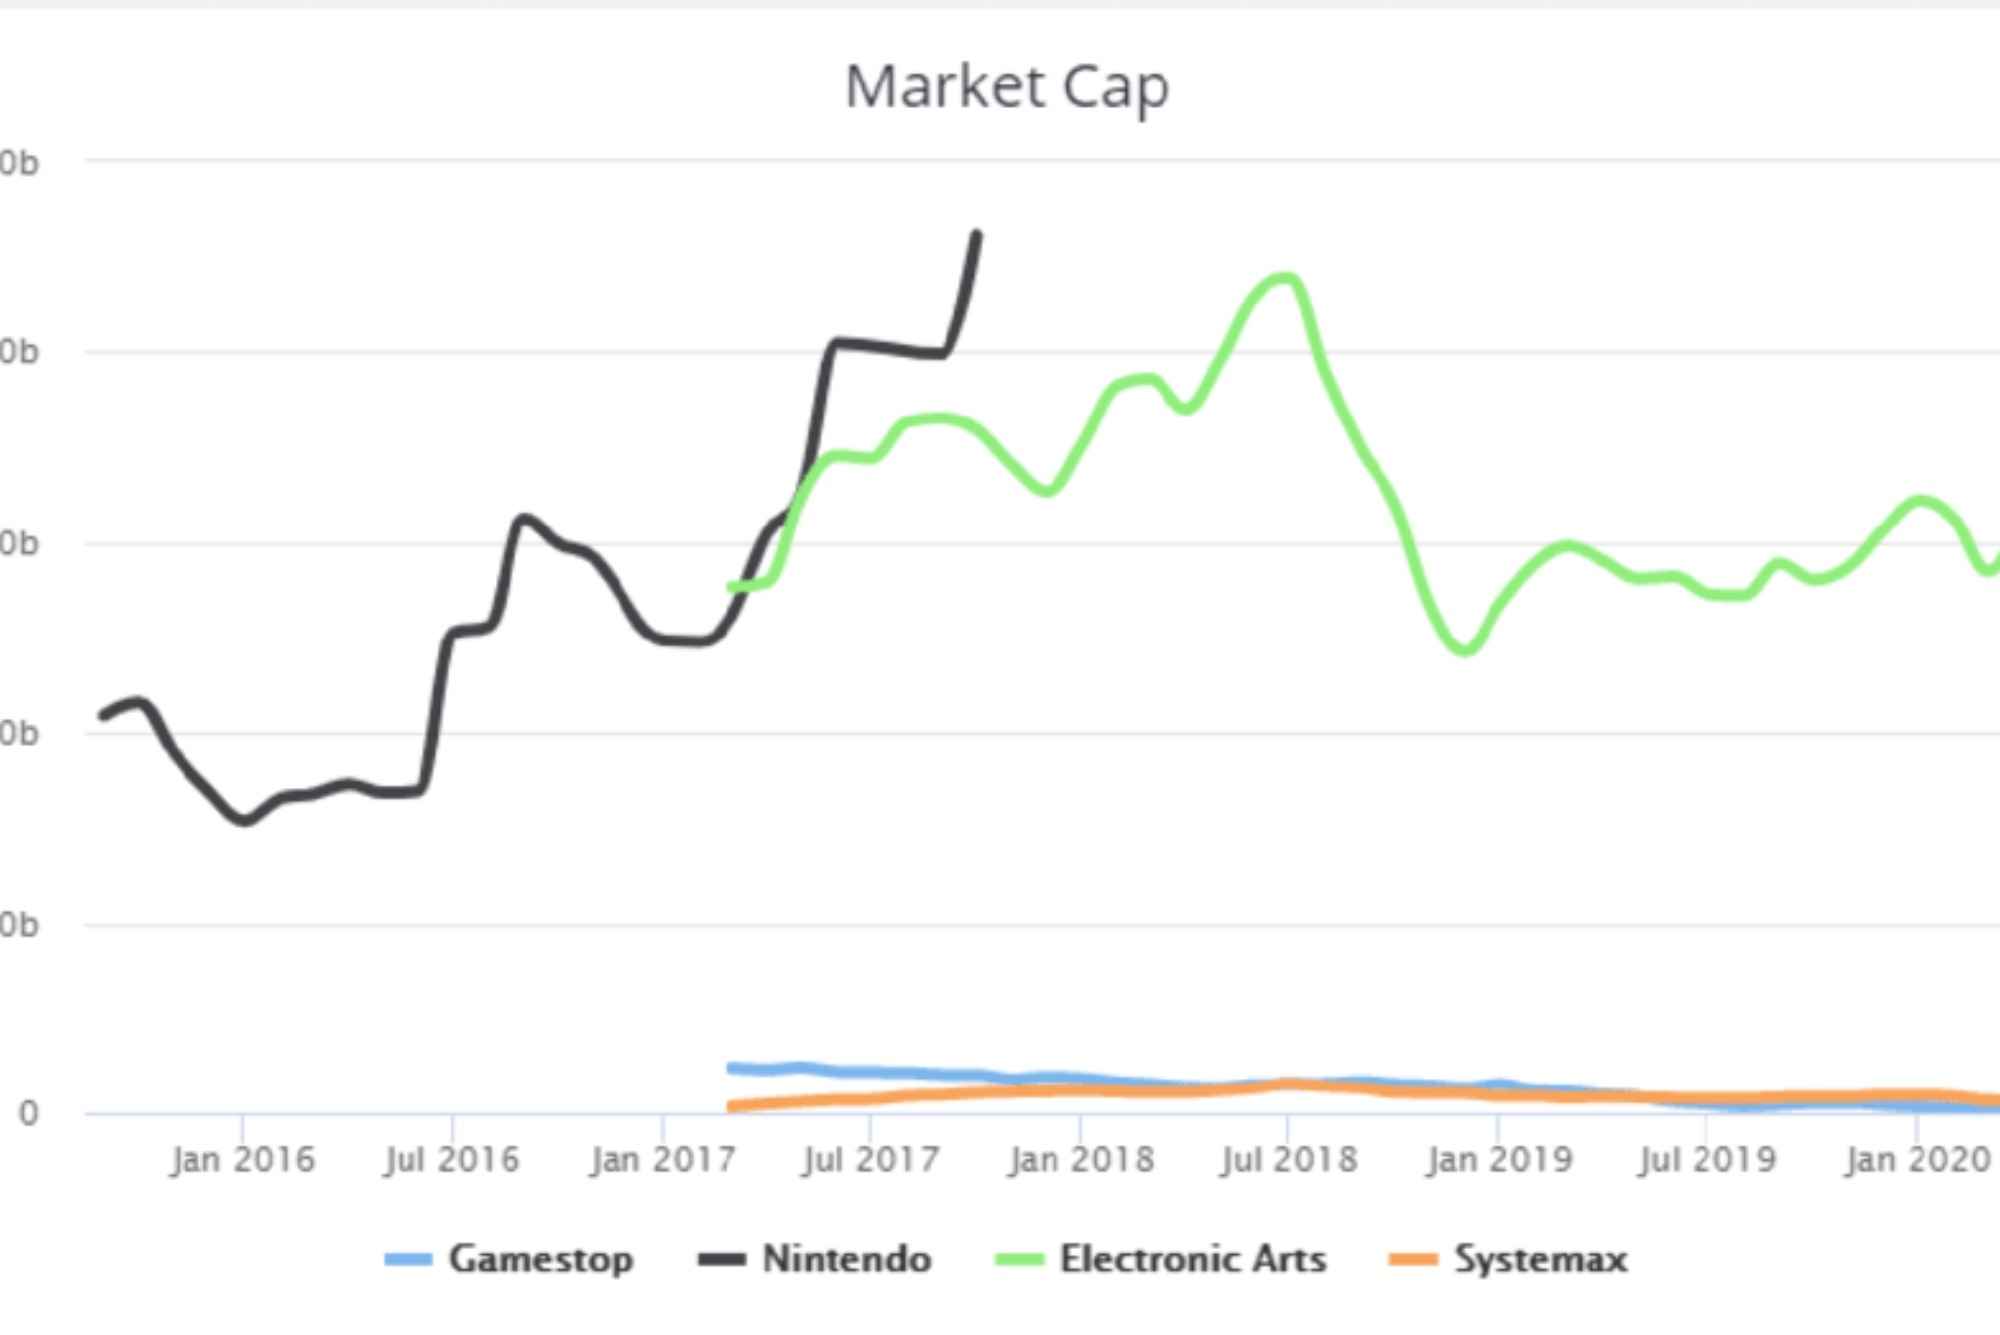
The world of cryptocurrency is fast-paced and ever-changing, making it essential for investors and enthusiasts to stay informed. One of the most crucial tools in this digital landscape is the cryptocurrency market cap live chart. This article explores the importance of market cap, how to interpret live charts, and how they can inform your investment decisions.
What is Cryptocurrency Market Cap
Cryptocurrency market cap is a measure of the total value of a cryptocurrency. It is calculated by multiplying the current price of a coin by the total number of coins in circulation. Market capitalization helps investors assess the relative size of a cryptocurrency compared to others in the market.
Generally, cryptocurrencies can be categorized into large-cap cryptocurrencies, which typically have a market cap of over $10 billion and are considered stable; mid-cap cryptocurrencies, which range between $1 billion and $10 billion and offer greater growth potential but also carry higher risks; and small-cap cryptocurrencies, valued below $1 billion, which are often more volatile and can lead to significant price swings. Understanding market cap is fundamental for anyone involved in cryptocurrency, as it reflects the overall health and liquidity of the market.
The Importance of Live Market Cap Charts
Live market cap charts provide real-time updates on the market capitalization of cryptocurrencies. This immediacy is critical for making informed trading decisions. In a market where prices can fluctuate rapidly, having access to real-time data allows investors to react quickly to changes, helping to capitalize on upward trends or minimize losses during downturns.

These charts are also useful for tracking the performance of various cryptocurrencies over time. By analyzing the live chart, investors can identify patterns, such as bullish or bearish trends, and make predictions about future movements. This analysis is particularly beneficial for traders looking to engage in day trading or short-term investments.
Key Components of a Cryptocurrency Market Cap Live Chart
A typical live market cap chart includes several important components. The current price displays the real-time price of a cryptocurrency, allowing investors to see immediate value. The market cap shows the total market capitalization of each cryptocurrency, which helps in comparing its value against others. Volume reflects the amount of trading activity over a specific period, indicating the liquidity and interest in a coin. Price changes track the percentage increase or decrease in price over different time frames, such as 24 hours, 7 days, or even 30 days. Historical data provides insights into past performance, allowing investors to analyze trends over longer periods.
How to Analyze a Live Market Cap Chart
To effectively analyze a cryptocurrency market cap live chart, one should look for trends by analyzing price movements over various time frames. Identifying whether a cryptocurrency is in a long-term uptrend, downtrend, or sideways movement can provide valuable insights. Additionally, comparing different cryptocurrencies can help assess their relative popularity and stability. Monitoring volume levels is essential, as high volume typically indicates more stability, while low volume can suggest potential risk. Watching for trend reversals can signal changes in investor sentiment or market direction, aiding in making timely investment decisions.
Popular Platforms for Live Market Cap Data
Investors can access live cryptocurrency market cap data through several platforms. CoinMarketCap is one of the most popular sources, providing comprehensive data on thousands of cryptocurrencies, including live charts, market cap rankings, and historical data. Its user-friendly interface makes it easy for beginners and experienced traders alike to navigate.
CoinGecko also offers extensive data on various cryptocurrencies, including market cap, trading volume, and community engagement metrics. Its unique feature is the inclusion of fundamental analysis, which helps users assess the potential of different coins. For those seeking advanced charting tools and technical analysis, TradingView provides powerful features, enabling users to create custom charts, apply technical indicators, and share their analyses with a broader community.
Understanding and utilizing cryptocurrency market cap live charts is essential for anyone looking to invest in digital assets. By staying updated with real-time data, investors can make informed decisions, react promptly to market fluctuations, and ultimately enhance their trading strategies. As the cryptocurrency market continues to evolve, having access to accurate and timely market cap information will remain a critical advantage.


